Example
Let’s say you want to track the different type of times (wall clock, on CPU and off CPU time) for the dependency injection involved in one of your cold start flows. Following are the steps you should follow:
-
Set the
android:exportedflag to true in yourAndroidManifest.xmlfor the activity you want to test. -
Go the scripts directory in project. Run the following command to get the dependency graph involved for activity involved in cold start:
./get_injection_time.sh -p <package-name> -c <activity-component-name>where,
-p : package name of the application
-c : component name of activity.So, for the sample app the command would be,
./get_injection_time.sh -p me.amanjeet.daggertrack -c me.amanjeet.daggertrack/me.amanjeet.daggertrack.ui.HomeActivity -
This command do following things:
- Clear the logcat
- Kills the app if present in background or foreground
- Launches the activity you passed and wait till it launches fully
- Extracts the logs having the
DaggerTrackdebug filter - Runs a python script which is responsible for generating the graph with nodes as different components involved and their respective times.
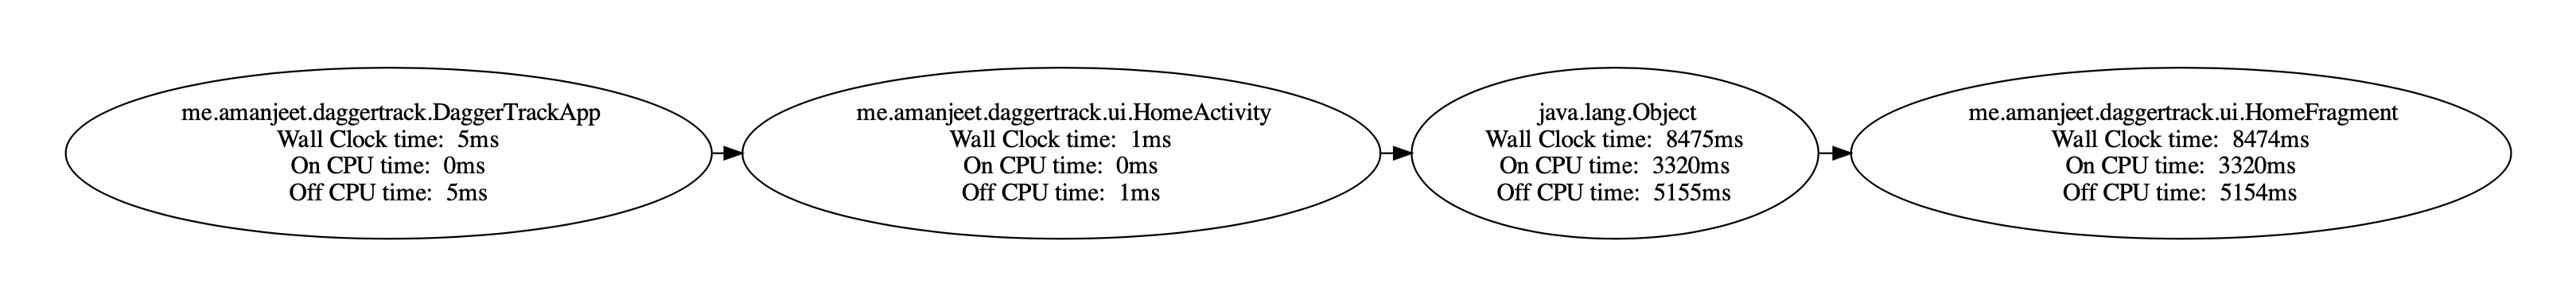
-
For dagger track sample app following is the generated graph:
Note
The python script runs on Python3 and needs graphviz module to plot graphs. You can run pip3 install -r requirements.txt to install all dependencies.